The Reporting page provides historical information for the last 6 months of broadcasting by default. This can be expanded to a maximum of 2 years. Information is updated nightly and available in several presets or custom periods.
Reporting Period
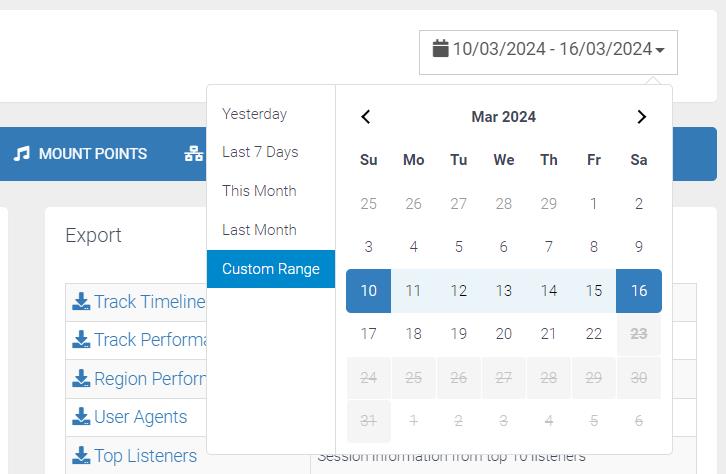
On the top right of every page is the reporting period selection. By Default, this will show yesterday’s data but can be set to a custom range or the following presets; Yesterday, Last 7 Days, This Month, or Last Month
Summary
Listeners
- Peak Listeners – The highest number of connections at one time over the period
- Unique Listeners – Refers to the individual listener connections including from the same IP address.
- Total Listener Hours (TLH) – The number of minutes or hours collectively listeners by all listeners. For example, 2 listeners over 30 minutes would be 1 Total Listener Hour.
- Data Transfer – Total – The total data transferred in the selected reporting period.
- Total Tracks Played – The total number of tracks played in the selected period.
- Unique Tracks Played – The total number of unique tracks played in the selected period.
- Peak Track – This will show the track with the highest peak listeners. It takes three lines to show the track metadata, peak listener count, and the time/date.
- Listeners over period – This Graph shows the listeners from the selected reporting period sorted by date/time and listener count.

Export
Several reports are available for downloading providing more detailed information into CSV format:
-
Track Timeline Play by play report of performances and TLH
-
Track Performance Session information grouped by track
-
Region Performance Session information grouped by region
-
User Agents Session information grouped by User Agent
-
Top Viewers Session information from top 10 viewers
-
Daily Traffic Daily summary of data consumed by station
-
Sound Exchange Sound Exchange compatible report
Other data can be directly downloaded with the Export buttons shown throughout. For example you can export the Sessions by Length data.
Summary
- Unique Listeners – Refers to the individual listener connections including from the same IP address.
- Unique Countries – The total unique countries from the listeners that have connected.
- Unique Cities – The total unique cities from the listeners that have connected.
- Unique User Agents – The total unique User Agents from the listeners that have connected.
- Total Listener Minutes (TLM) – The number of minutes collectively listeners by all listeners. For example, 2 listeners over 30 minutes would be 1 Total Listener Hour.
- Total Listener Hours (LTH) – The number of hours collectively listeners by all listeners. For example, 2 listeners over 30 minutes would be 1 Total Listener Hour.
Sessions
- Total Sessions – The number of total sessions from the selected reporting period.
- Average Session Length – The calculated average length of session from the reporting period.
- Average Sessions Per Day – The calculated average daily sessions the reporting period.
- Average Sessions Per Hour – The calculated average hourly sessions from the reporting period.
- Data Transfer – Total – The total data transferred in the selected reporting period.
- Data Transfer – Session Avg. – The calculated average data transfer per session from the reporting period.
Sessions by Length
This section shows a pie chart of the length of sessions.
GeoIP Map
The GeoIP map shows the colour intensity of each country based on how many listeners or viewers come from this region.
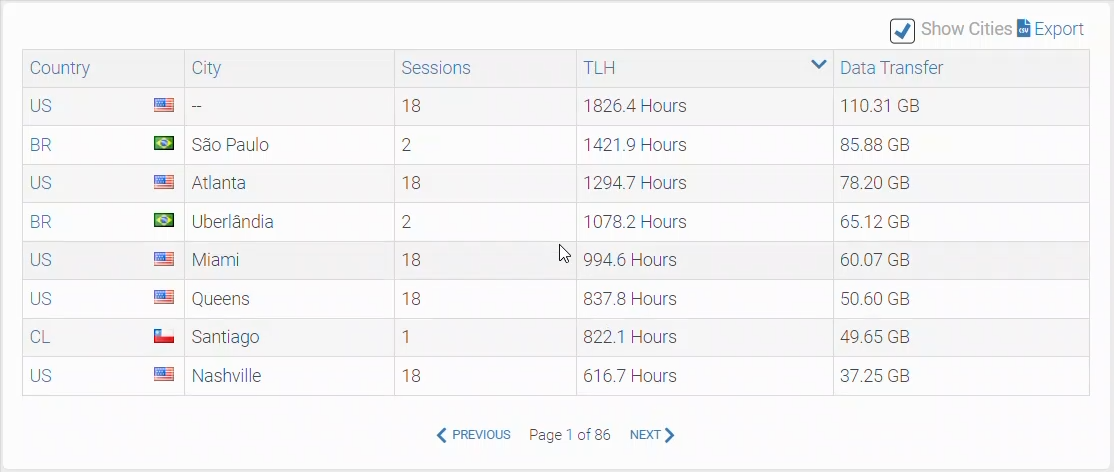
Popular Regions
Shows a sortable table of popular regions with information on the session count, TLH, City, and Data Transfer.
Top Listeners
Shows a sortable table of the Top Listeners with the IP Address, Country, City, Session count, and TLH.
Top User Agents
Shows a sortable table of the Top User Agents with the Country, City, Session count, and TLH.
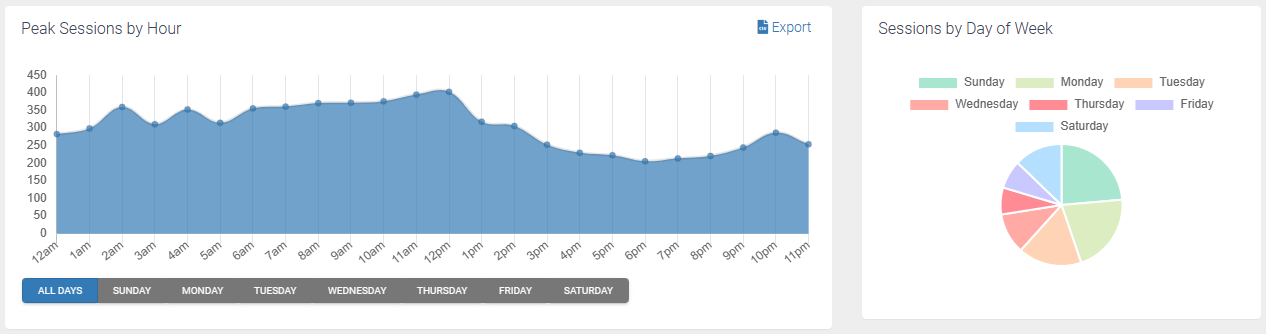
Sessions by Time Period
Peak Sessions by Hour
This Graph shows the listeners from the selected reporting period sorted by date/time and listener count.
Sessions by Day of Week
This section shows a pie chart of the quantity of sessions based on day of week.
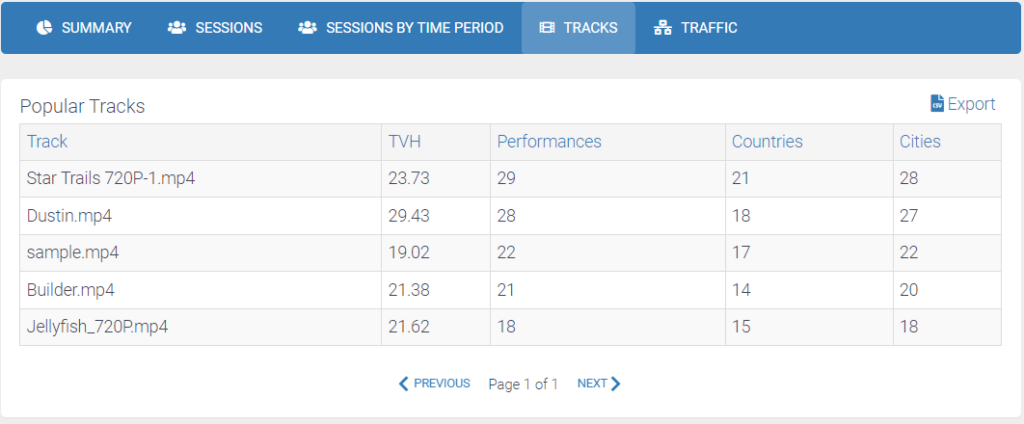
The Tracks tab shows the services popular tracks comprehensive and sortable data table that is dynamically loaded and is exportable.
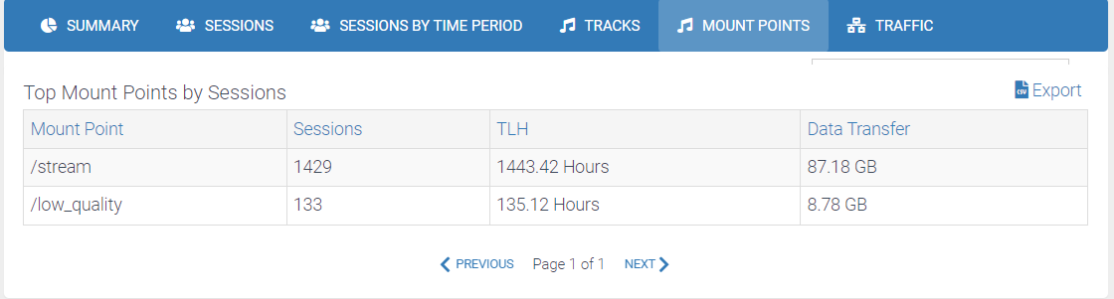
The Mount Points tab is only accessible on Icecast Services. This page shows the top mount points by session in a sortable data table that is dynamically loaded and is exportable.